Opioid Related Deaths and Opioid Prevalence
- Prepared by:
- J M Maxwell, Center for Translational Data Science (CTDS), University of Chicago
Attribution
In this notebook, we utilize data from the DEA-ARCOS and CDC WONDER datasets to demonstrate how data accessed through the HEAL Data Platform can be analyzed in a HEAL workspace.
The purpose of this notebook is to demonstrate how the data may be accessed and used for analysis, and is intended to be used as a jumping off point for researchers who may wish to use these data for their own secondary analyses. While some of the analyses below may recreate analyses presented in the original publication, they are not intended to replicate the original results and differences in analytic methods and software, selection/filtering of observations, and handling of missing data may yield results that differ from the original.
The work here was conducted without direct involvement of the original authors and therefore does not necessarily reflect the views or opinions of the authors, of the NIH HEAL Initiative®, or of the Center for Translational Data Science (CTDS) at the University of Chicago.
Table of Contents
Setup Notebook
Import Datasets
National Opioid Deaths and Opioid Prevalence
Data Cleaning
West Virginia’s Opioid Overdoses And Suicides
Conclusions
1) Setup Notebook
import os
import shutil

import numpy as np
import pandas as pd
import requests
import warnings
warnings.simplefilter(action='ignore', category=FutureWarning)
import matplotlib.pyplot as plt
from matplotlib.ticker import FuncFormatter
import matplotlib.patches as mpatches
from pathlib import Path
import os

from IPython.display import Markdown, Image, display
!gen3 drs-pull object dg.H34L/4b26774b-4629-4363-8443-e335d0de40c2
!gen3 drs-pull object dg.H34L/173bf921-776f-4c86-8ea0-619afdba0f1e
!gen3 drs-pull object dg.H34L/4f2764bd-8847-4037-ad1b-0c16d15f38d9
!gen3 drs-pull object dg.H34L/8128a7c0-1791-4380-b7b1-a9af8a104304
!gen3 drs-pull object dg.H34L/e091ebec-f111-4917-8317-204c6b969011
!gen3 drs-pull object dg.H34L/b1aa1e7c-7869-475a-841c-e2a94ac79481
!gen3 drs-pull object dg.H34L/f726fbdb-c7c1-423d-99d7-842da441b509{"succeeded": ["dg.H34L/4b26774b-4629-4363-8443-e335d0de40c2"], "failed": []}
{"succeeded": ["dg.H34L/173bf921-776f-4c86-8ea0-619afdba0f1e"], "failed": []}
{"succeeded": ["dg.H34L/4f2764bd-8847-4037-ad1b-0c16d15f38d9"], "failed": []}
{"succeeded": ["dg.H34L/8128a7c0-1791-4380-b7b1-a9af8a104304"], "failed": []}
{"succeeded": ["dg.H34L/e091ebec-f111-4917-8317-204c6b969011"], "failed": []}
{"succeeded": ["dg.H34L/b1aa1e7c-7869-475a-841c-e2a94ac79481"], "failed": []}
{"succeeded": ["dg.H34L/f726fbdb-c7c1-423d-99d7-842da441b509"], "failed": []}
Common Code for Graphics
def thousands(x, pos):
    return "%1.0fK" % (x * 1e-3)

def millions(x, pos):
    return "%1.0fM" % round((x * 1e-6), 4)

def percents(x, pos):
return f"{round(x, 4)}%"arcos_drug_list = pd.read_csv("dea_arcos_drug_list.tsv", sep="\t")
arcos_df = pd.read_csv("dea_arcos_county_population.tsv", sep="\t")
arcos_df1 = pd.read_csv("dea_arcos_combined_county_annual.tsv", sep="\t")
arcos_state_pop = pd.read_csv("dea_arcos_state_population.tsv", sep="\t")
arcos_drug_list = arcos_drug_list.drop(['Unnamed: 0'], axis = 1)
arcos_df["KEY"] = arcos_df["BUYER_COUNTY"] + ', ' + arcos_df["BUYER_STATE"] + ", " + arcos_df["year"].astype(str)
arcos_df = arcos_df[["KEY", "BUYER_COUNTY", "BUYER_STATE", "year", "population"]]
arcos_df1["KEY"] = arcos_df1["BUYER_COUNTY"] + ', ' + arcos_df1["BUYER_STATE"]+ ", " + arcos_df1["year"].astype(str)
arcos_df1 = arcos_df1[["KEY", "BUYER_STATE", "count", "DOSAGE_UNIT"]]
arcos_df1 = arcos_df1[arcos_df1["KEY"].notna()]
counts = arcos_df1.set_index("KEY")["count"].to_dict()
doses = arcos_df1.set_index("KEY")["DOSAGE_UNIT"].to_dict()
arcos_df["count"] = arcos_df["KEY"].map(counts)
arcos_df["dosages"] = arcos_df["KEY"].map(doses)
arcos_df["pills per capita"] = arcos_df["count"] / arcos_df["population"]
display(Markdown(arcos_drug_list.to_markdown()))
display(Markdown(arcos_df.head(5).to_markdown()))Import the DEA ARCOS datasets for county and state populations from 2006 to 2014, and for the total pharmacy and practitioner pill counts by county and year. The county population and pill counts datasets are combined using a common key (county name, state name, year). An additional feature is added, ‘pills per capita’, which is the number of opioid pills per person in each county. Some counties have an abnormally large ratio of opioid pills per person; however, these are from low-county-population sizes.
DEA ARCOS: https://
Import CDC WONDER
annual_overdoses = pd.read_csv("./CDC_WONDER_unintentional_overdoses.tsv", sep="\t")
annual_suicides = pd.read_csv("./CDC_WONDER_suicide_overdoses.tsv", sep="\t")
monthly_overdoses = pd.read_csv("./monthly_unintentional_overdoses.tsv", sep="\t")

annual_overdoses = annual_overdoses.drop(["Unnamed: 0", "Notes", "Year Code", "State Code"], axis=1)
annual_overdoses = annual_overdoses[annual_overdoses["Deaths"].notna()]
annual_overdoses["Year"] = annual_overdoses["Year"].map(lambda x: str(x)[:-2])
annual_overdoses['% of Population'] = (annual_overdoses['Deaths']/annual_overdoses['Population'])*100

annual_suicides = annual_suicides.drop(['Unnamed: 0', 'Notes', 'State Code', 'Year Code'], axis = 1)
annual_suicides = annual_suicides[annual_suicides['Deaths'].notna()]
annual_suicides["Year"] = annual_suicides["Year"].map(lambda x: str(x)[:-2])
annual_suicides['% of Population'] = (annual_suicides['Deaths']/annual_suicides['Population'])*100

monthly_overdoses = monthly_overdoses.drop(['Notes', 'State Code', 'Year Code', 'Population', 'Crude Rate'], axis = 1)
monthly_overdoses = monthly_overdoses[monthly_overdoses['Deaths'].notna()]
monthly_overdoses["Year"] = monthly_overdoses["Year"].map(lambda x: str(x)[:-2])

display(Markdown(annual_overdoses.head(5).to_markdown()))
display(Markdown(annual_suicides.head(5).to_markdown()))Import the CDC WONDER datasets for annual, recorded opioid related unintentional overdoses and suicides, and monthly unintentional opioid overdoses. HEAL hosts the entire CDC WONDER dataset as well as these filtered datasets. Below are links to the CDC WONDER codebook explaining the ICD (International Classifications of Diseases) codes used in filtering for opioid related deaths and to the CDC WONDER website.
CDC WONDER: https://
ICD Opioid Codebook: https://
3) National Opioid Deaths And Opioid Prevalence
National Unintentional Opioid Overdoses And Suicides
national_overdoses = annual_overdoses.groupby("Year")["Deaths"].sum() + annual_suicides.groupby("Year")["Deaths"].sum()
fig, ax = plt.subplots(1, 1, figsize=(12, 6))
ax.vlines(
    x=national_overdoses.index,
    ymin=0,
    ymax=national_overdoses,
    color="grey",
    alpha=1.0,
    linewidth=4,
)

ax.set_title(f"Annual National Opioid Overdoses And Suicides", size=14)
plt.grid(axis="y", alpha=0.3)
ax.set_xlabel("Year", size=12)
ax.set_ylabel("Deaths", size=11)
formatter = FuncFormatter(thousands)
ax.yaxis.set_major_formatter(formatter)
fig.autofmt_xdate(rotation=45)

plt.show()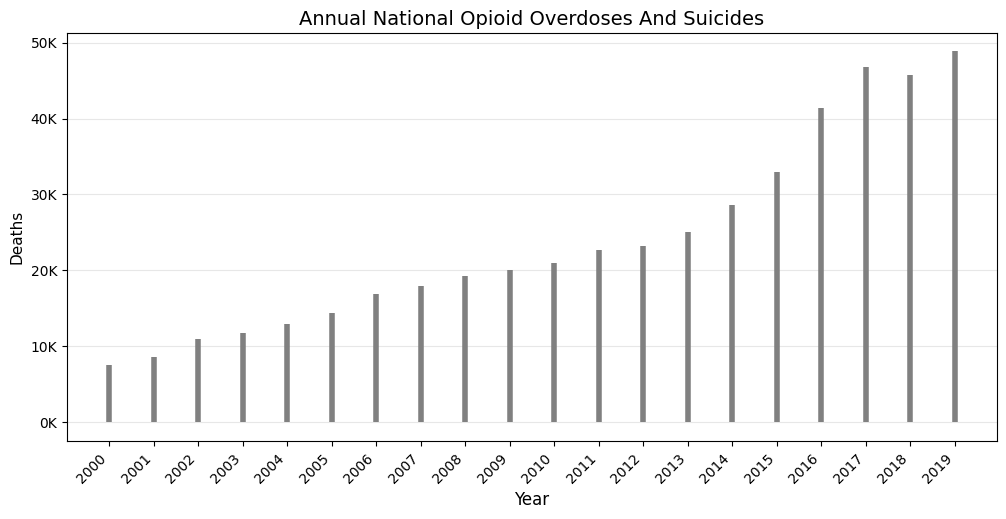
We see above that since 2000 the annual number of unintentional opioid overdoses and suicides has increased by more than a factor of five, and that, since 2010, the annual number of deaths has more than doubled.
National Opioid Prevalence
opioids_yearly = arcos_df.groupby('year')['count'].sum()

fig, ax = plt.subplots(1, 1, figsize=(12, 6))
ax.plot(opioids_yearly, color = 'grey')
ax.set_title(f"Annual National Pharmacy and Practitioner Pill Count", size=14)
plt.grid(axis="y", alpha=0.3)
ax.set_xlabel("Year", size=12)
ax.set_ylabel("Pill Count", size=11)
formatter = FuncFormatter(millions)
ax.yaxis.set_major_formatter(formatter)
fig.autofmt_xdate(rotation=45)

plt.show()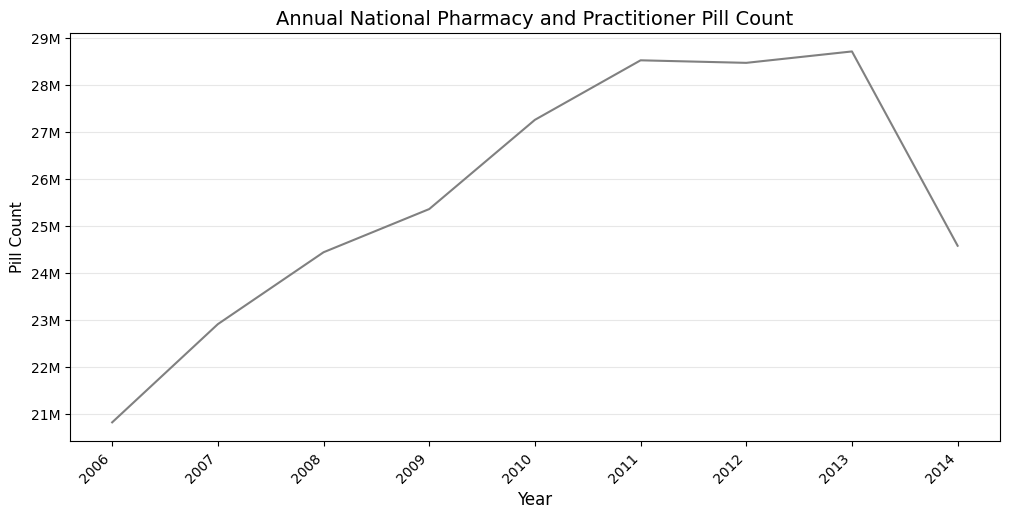
We see above that the number of opioid pills in the United States has increased steadily from 2006 until 2013 when a significant decline occurred in the annual opioid pill count. It should be noted that the count only records pharmacy and practitioner’s pill counts and does not include any illicit opioids. The types of opioids included in the count are listed in the arcos_drug_list dataframe shown previously.
States With The Highest Annual Overdose Rate
top_states = (
    annual_overdoses.groupby("Year")[["State", "% of Population"]]
    .apply(lambda grp: grp.nlargest(1, "% of Population"))
    .reset_index()
)
top_states['State_and_Year'] = top_states['State'] + ', ' + top_states['Year']
top_states = top_states.drop(['Year', 'level_1', 'State'], axis = 1)

fig, ax = plt.subplots(1, 1, figsize=(12, 6))
ax.vlines(
    x=top_states['State_and_Year'],
    ymin=0,
    ymax=top_states['% of Population'],
    color="grey",
    alpha=1.0,
    linewidth=2.5,
)

ax.set_title(f"Unintentional Opioid Overdoses", size=14)
plt.grid(axis="y", alpha=0.3)
ax.set_xlabel("State and Year", size=12)
ax.set_ylabel("Overdoses As Percent \n Of Population", size=11)
formatter = FuncFormatter(percents)
ax.yaxis.set_major_formatter(formatter)
fig.autofmt_xdate(rotation=45)

plt.show()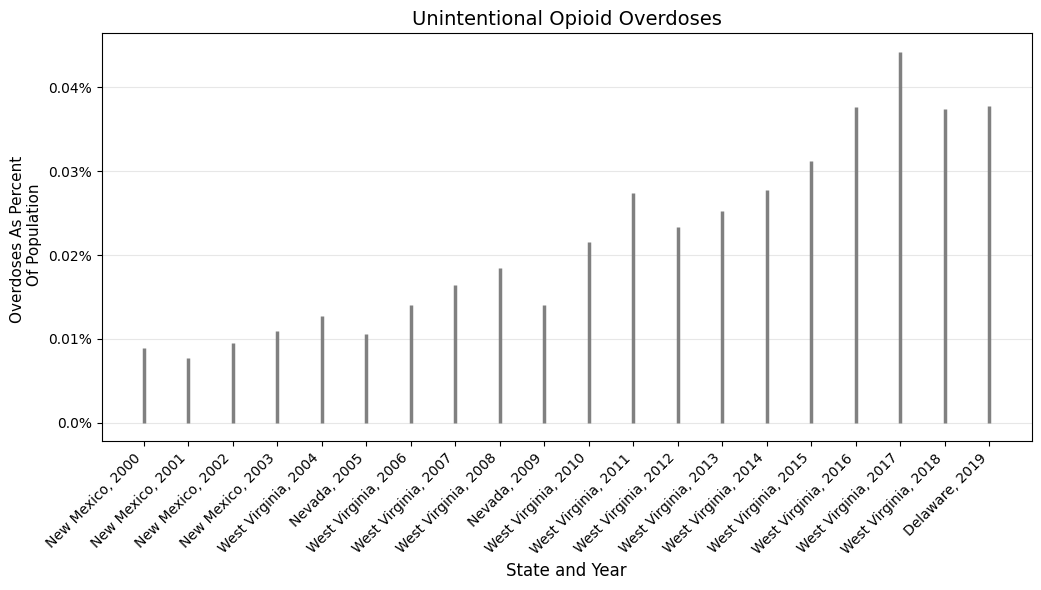
In the last twenty years, West Virginia has consistently had the highest percentage of unintentional opioid overdose deaths. West Virginia is the leading state for opioid overdose deaths in thirteen of the last twenty years, including during the time period where there was a significant increase in annual opioid related overdoses and suicides (see figure 1).
Going forward, we will take a closer look at West Virginia’s statewide opioid overdose and suicide mortality rate, and respective changes in anti-epidemic policy.
4) Data Cleaning
overdoses_wv = annual_overdoses[annual_overdoses["State"] == "West Virginia"].reset_index(drop=True)
overdoses_wv = overdoses_wv.reset_index()

suicides_wv = annual_suicides[annual_suicides["State"] == "West Virginia"].reset_index(drop=True)
suicides_wv = suicides_wv.reset_index()

monthly_overdoses_wv = monthly_overdoses[monthly_overdoses["State"] == "West Virginia"].reset_index(drop=True)
monthly_overdoses_wv = monthly_overdoses_wv.reset_index()

years  = ['2006', '2007', '2008', '2009', '2010', '2011', '2012',
          '2013', '2014', '2015', '2016', '2017', '2018', '2019']
ticks = []
for year in years:
    index = monthly_overdoses_wv.index[monthly_overdoses_wv['Year'] == year][0]
    ticks.append(index)
5) West Virginia’s Opioid Overdoses and Suicides
fig, ax = plt.subplots(1, 1, figsize=(12, 6))

lns1 = ax.bar(overdoses_wv['Year'], overdoses_wv['Deaths'], label='Overdoses', width=0.5, color='grey')
lns2 = ax.bar(suicides_wv['Year'], suicides_wv['Deaths'], label='Overdoses', width=0.5, color='red')

ax.set_title(f" West Virginia's Annual Opioid Overdoses and Suicides", size=14)
ax.set_xlabel("Year", size=12)
ax.set_ylabel("Deaths", size=11)
red_patch = mpatches.Patch(color='red', label='Suicides')
grey_patch = mpatches.Patch(color='grey', label='Overdoses')
plt.legend(handles=[grey_patch, red_patch])

fig.autofmt_xdate(rotation=45)

plt.show()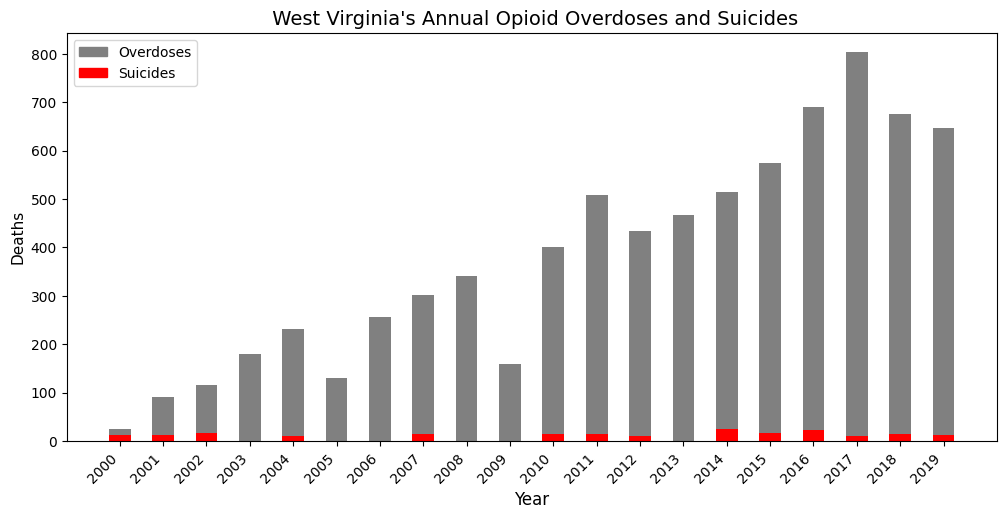
overdoses_wv['Deaths'].min()24.0fig, ax = plt.subplots(1, 1, figsize=(12, 6))
plt.xticks(ticks)
start = monthly_overdoses_wv.index[monthly_overdoses_wv['Year'] == '2006'][0]
end = monthly_overdoses_wv.index[monthly_overdoses_wv['Year'] == '2019'][1]
monthly_overdoses_wv['RollingYrAvg'] = monthly_overdoses_wv['Deaths'].rolling(6).mean()
lns1 = ax.vlines(
x=monthly_overdoses_wv.iloc[start:end].index,
ymin=0,
ymax=monthly_overdoses_wv['Deaths'].iloc[start:end],
color="grey",
alpha=1.0,
linewidth=1.0,
label = 'Deaths'
)
lns2 = ax.plot(monthly_overdoses_wv['RollingYrAvg'].iloc[start:end], color = 'green', label = 'Deaths Rolling Avg.')
ax.set_title(f"West Virginia's Monthly Unintentional Overdose Deaths", size=14)
ax.set_xlabel("Year", size=12)
ax.set_xticklabels(years)
ax.set_ylabel("Unintentional Overdose Deaths", size=11)
ax.legend(loc=2)
fig.autofmt_xdate(rotation=45)
plt.show()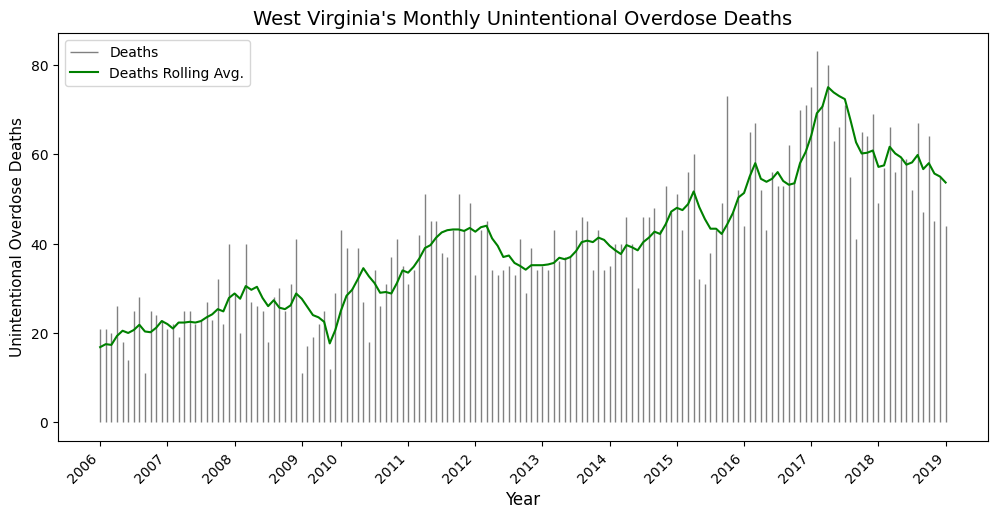
Since 2000, the annual number of reported unintentional opioid overdoses has grown from 24 in 2000 to over 600 in 2019, and since 2010, the annual number of unintentional overdoses has nearly doubled. The number of opioid related suicides has remained relatively steady since 2000.
The second image looks at West Virginia’s monthly unintentional overdoses with a 6 month rolling average. Here we can see there is not a large level of variation to the number of deaths on a monthly basis, but the 6 month rolling average has a clear upward trend.
*The bar graphs for overdoses and suicides are superimposed, not stacked.
*Some data is missing at a monthly level, particularly prior to 2010.
6) Conclusions
In this notebook we first looked at (figure 1) the annual national opioid suicides and unintentional overdoses and in (figure 2) the annual national pharmacy and practitioner opioid pill counts. Next, we found (figure 3) the states each year who have the highest rate of unintentional opioid overdose deaths as a percentage of each state’s respective population. Finally, we examined opioid related suicides and unintentional overdoses at the state level in West Virgina (figure 4 and 5).